
Performace Dashboard
A Power BI dashboard designed to analyze pizza sales performance, helping store owners and managers understand revenue drivers, customer ordering behavior, and menu performance. The goal was to transform raw transactional data into actionable insights that improve decision-making.
Pizza shops collect lots of orders but struggle to see which products, times, and behaviors drive revenue. I set out to design a dashboard that surfaces the right KPIs at a glance, reveals patterns in customer behavior, and supports decisions around promotions, staffing, and inventory.
Data Cleaning (Power Query): Set types, handled missing values, split columns where helpful.
Data Modeling: Referenced queries to create fact & dimension tables; star schema for faster DAX and visuals.
KPI Selection: Researched common pizza-shop metrics; tracked Total Revenue, Total Orders, Multi-Item %, Sales by Size/Category/Time, and MoM % deltas for context.
Design Choices: Treemap for “Sales by Pizza” (color = category, area = revenue), combo line+bar for revenue vs orders, conditional colors (green = highest, red = lowest; eg. Sunday is lowest).
This section showcases the key perspectives of the dashboard: overall sales performance, menu analysis, and customer behavior. Each view is designed to surface actionable insights at a glance, from identifying peak order times and best-selling pizzas to uncovering opportunities for combo deals and upselling.
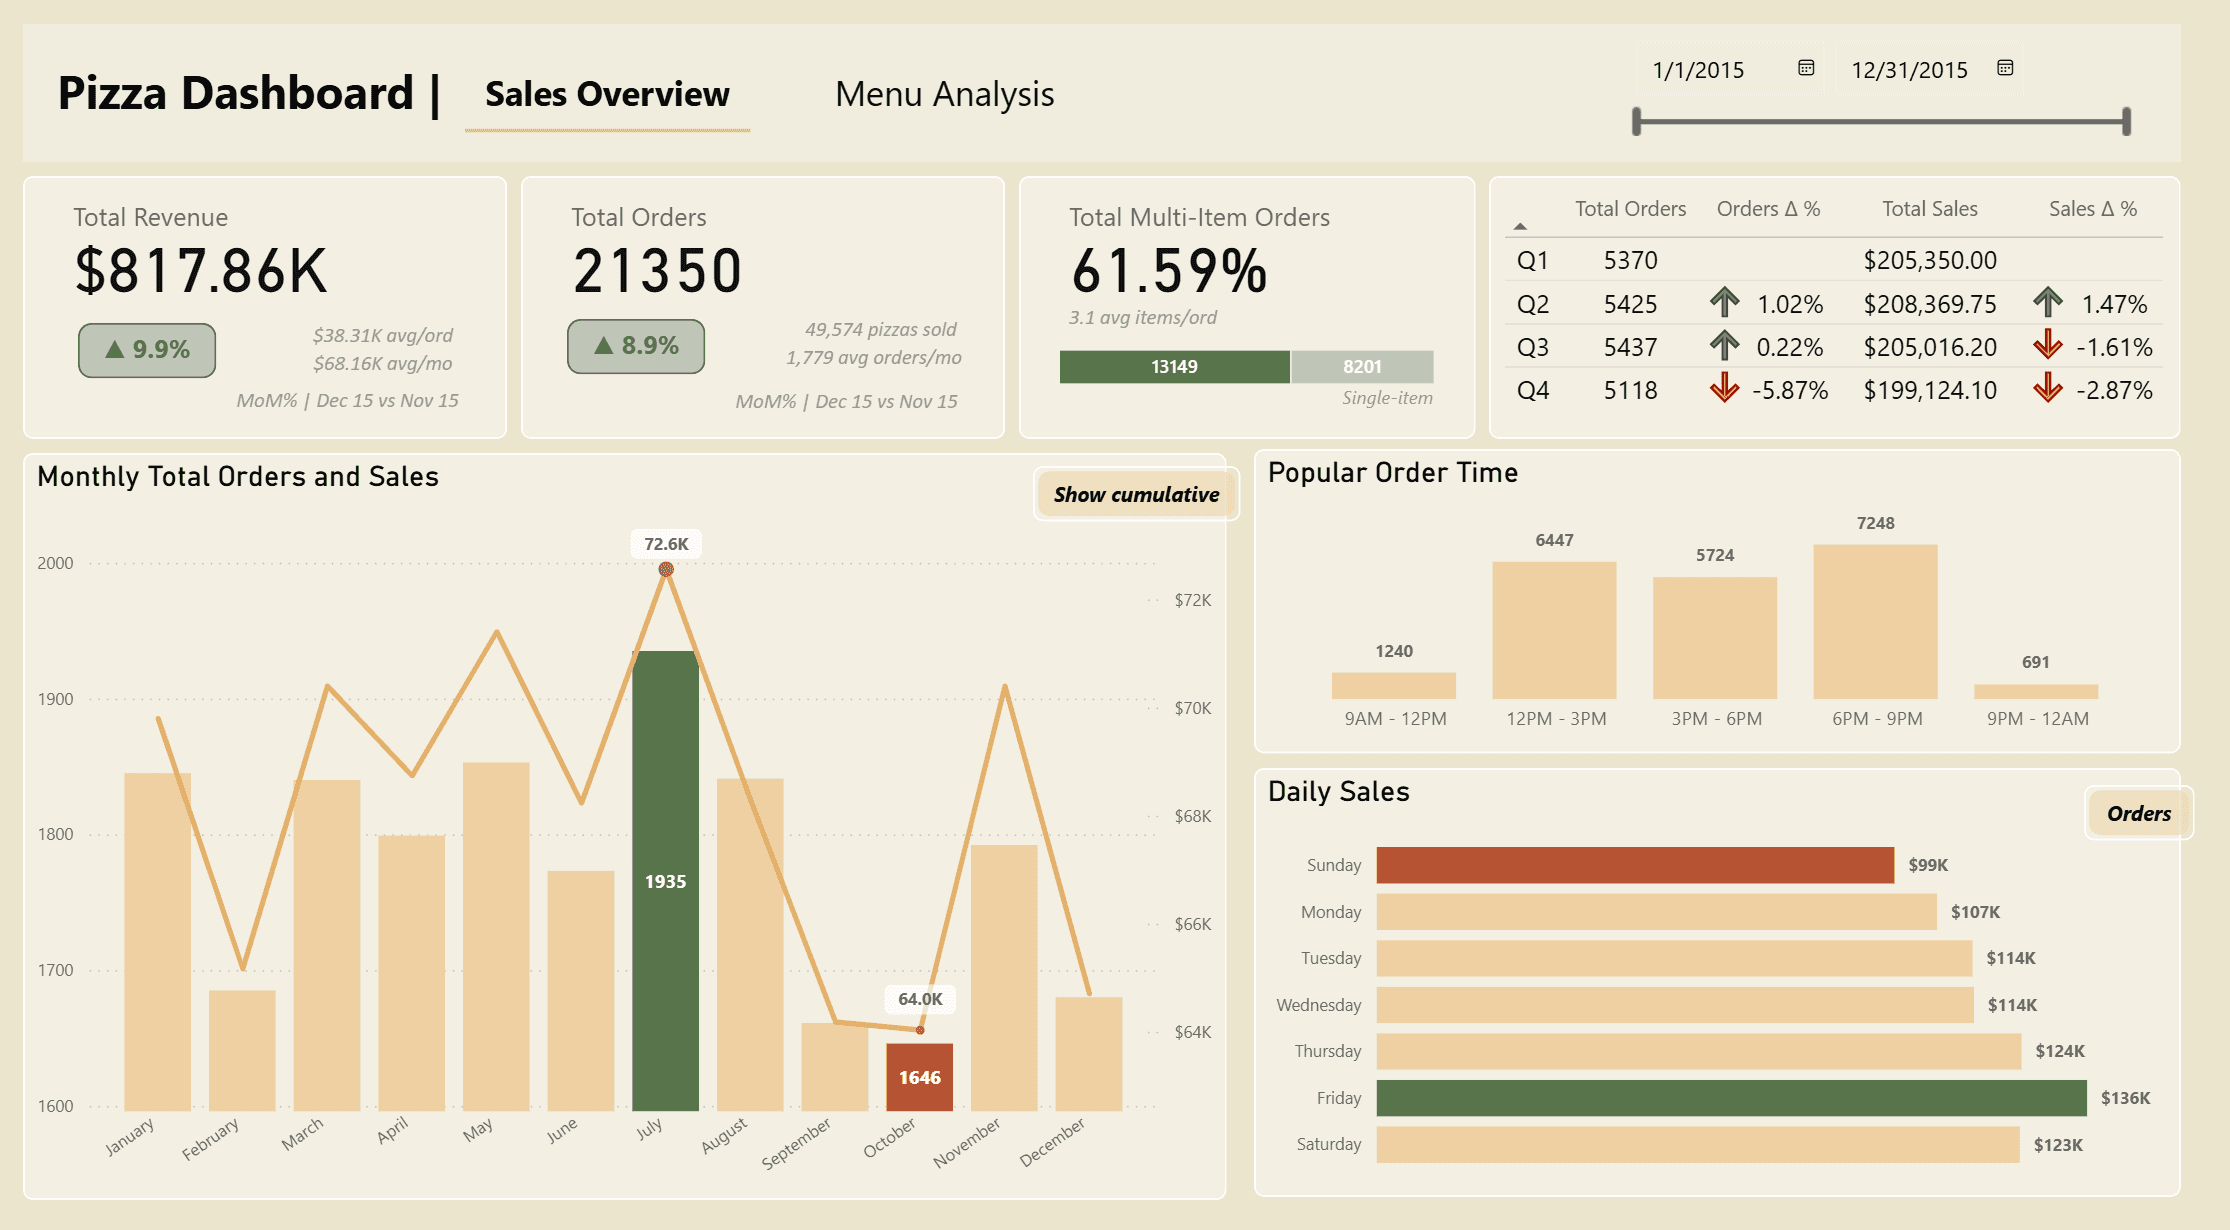
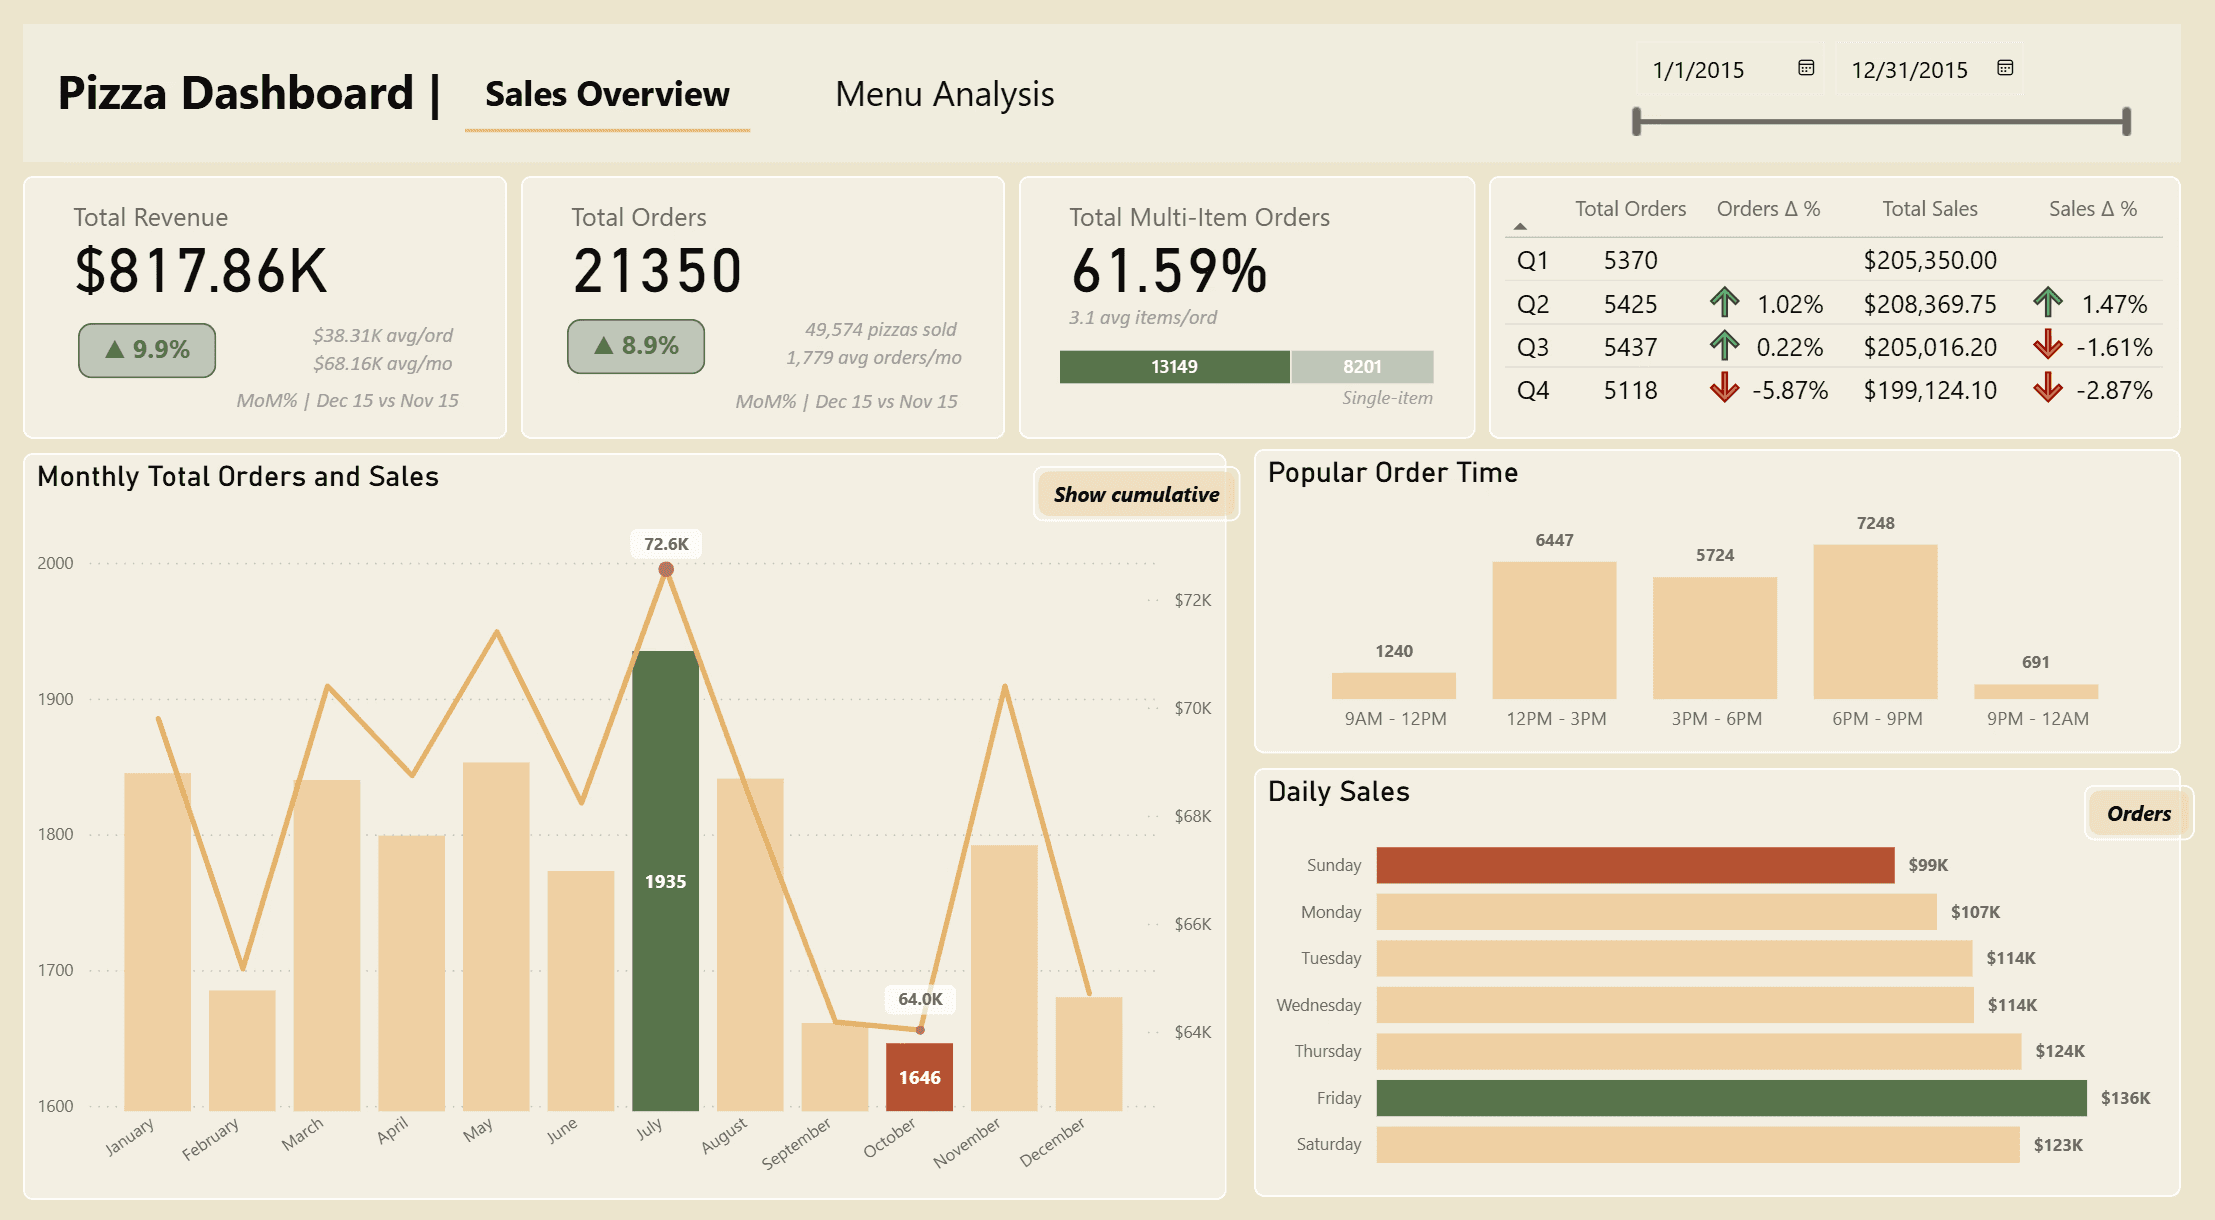
Sales Overview:
KPIs with MoM context, monthly revenue vs orders, daily patterns, and peak order times (5 - 8pm).
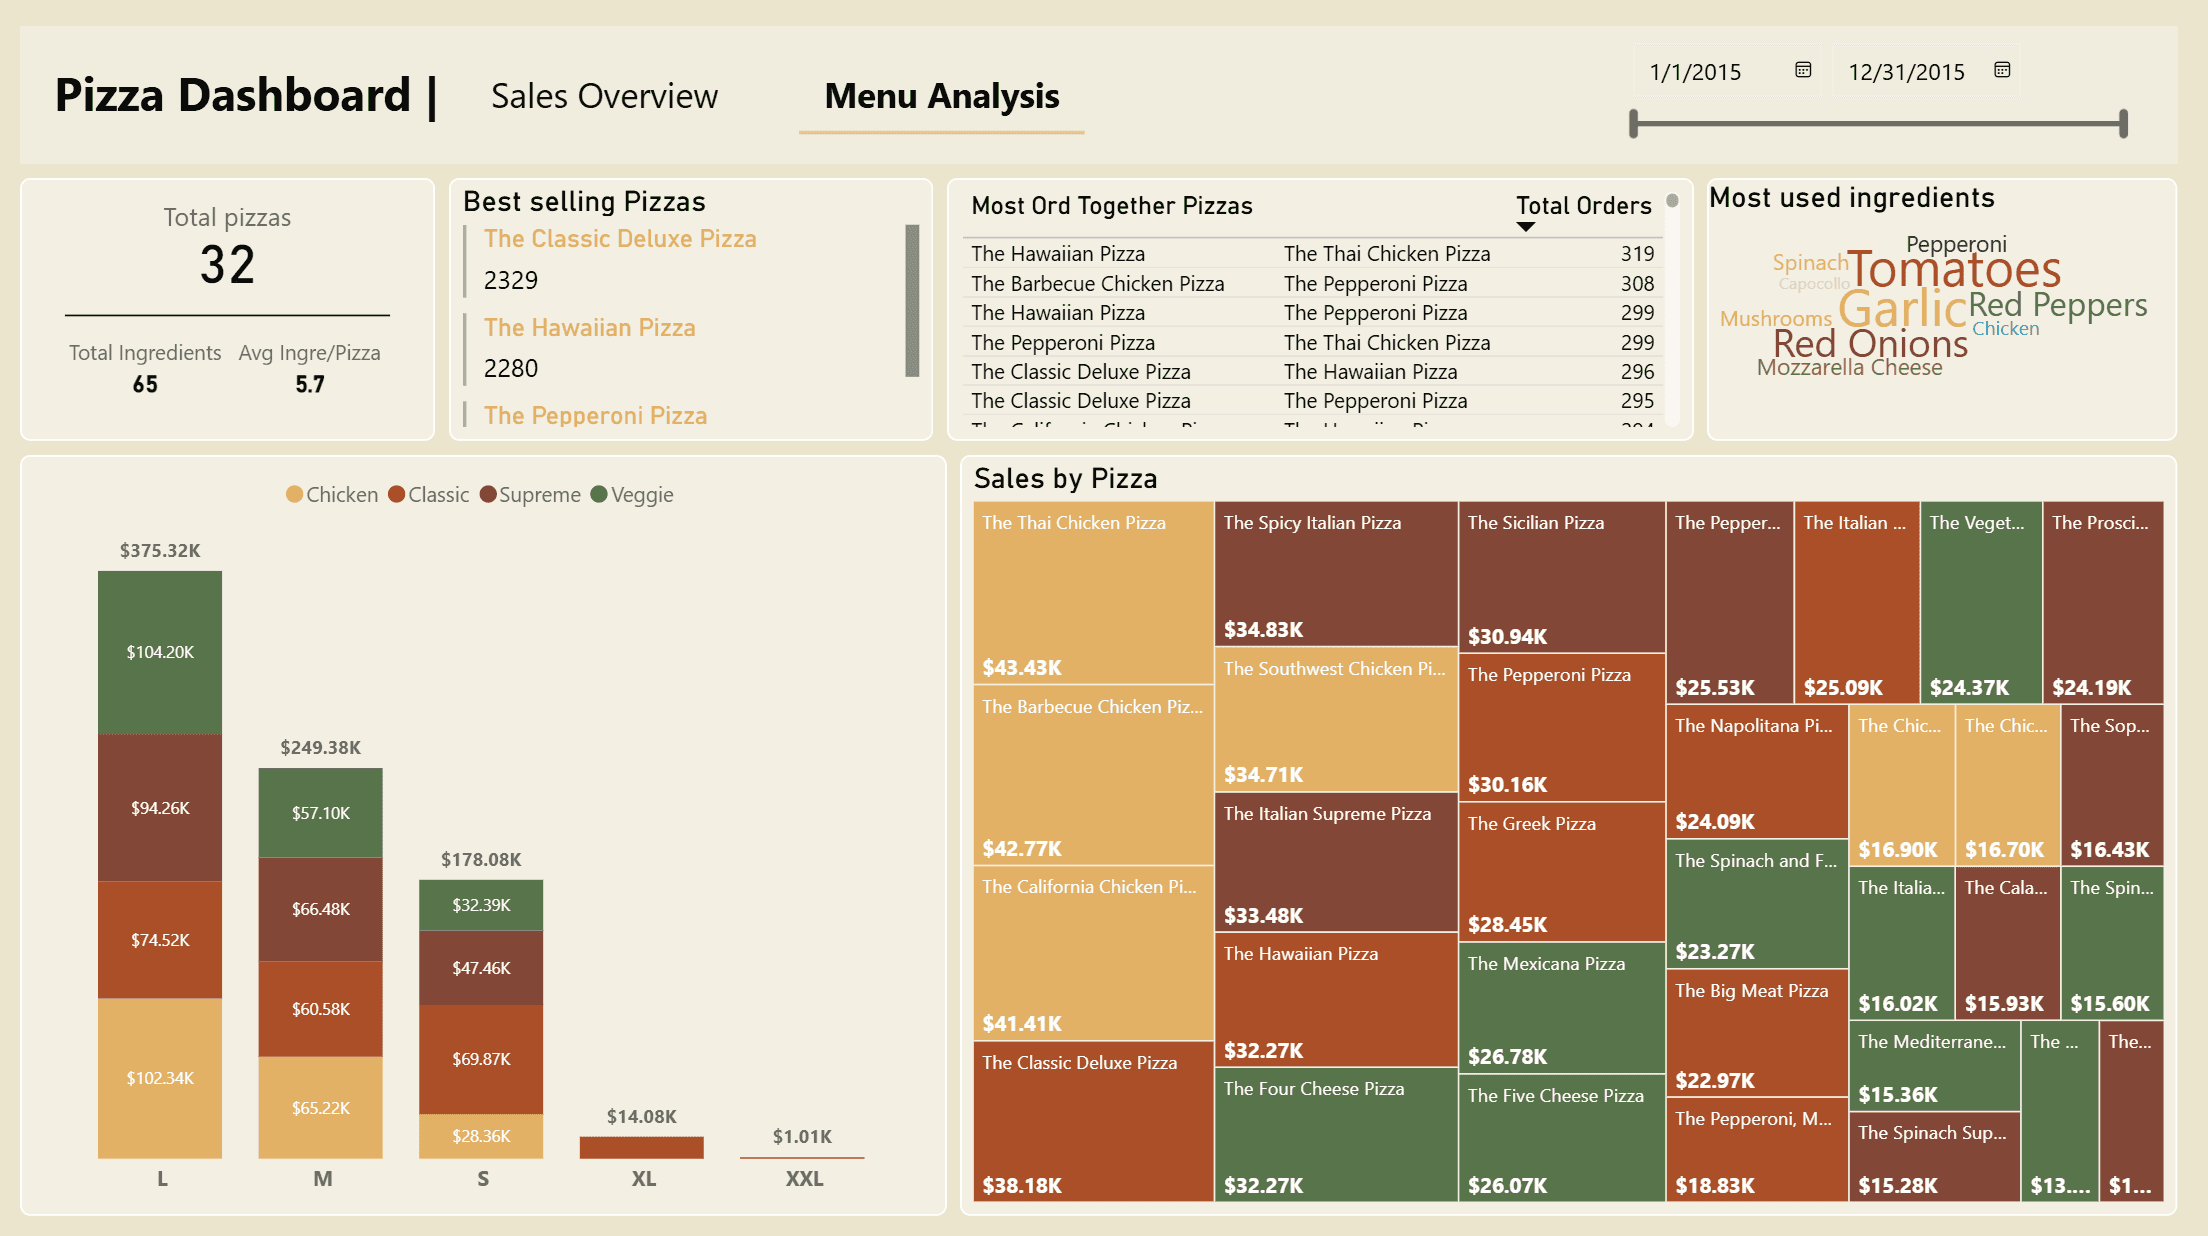
Menu Analysis:
Treemap compares pizzas within categories and ranks revenue contribution. Ingredient usage supports stocking.
Customer Behavior:
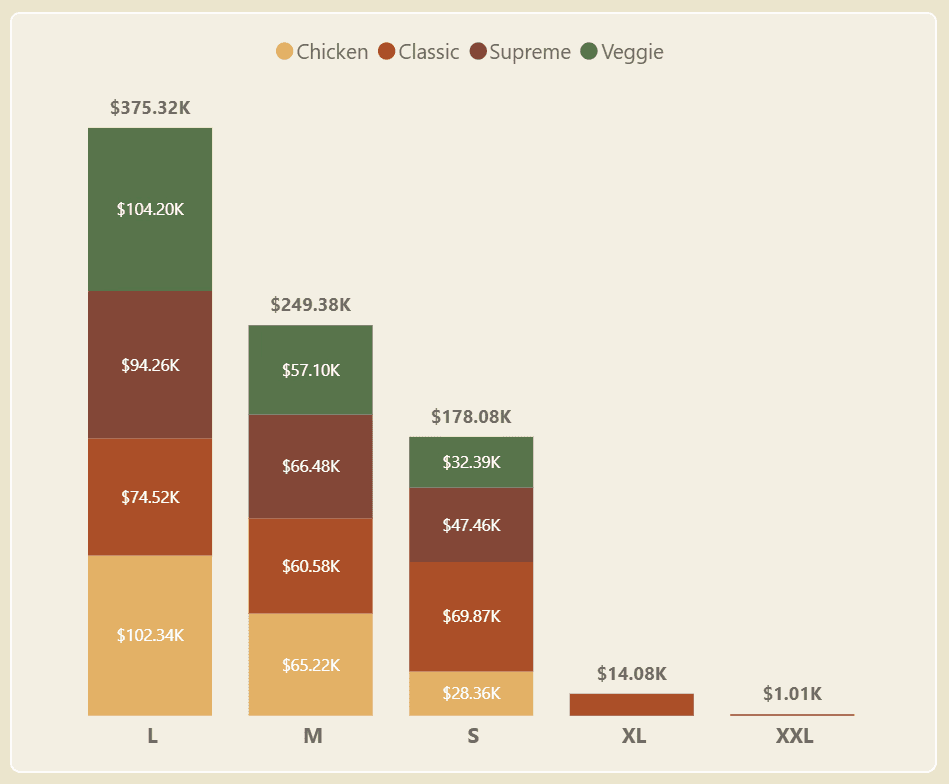
Multi-item share (61.6%) and size mix (Large leads) → opportunities for bundles and upsell.

$817.8K revenue from 21,350 orders.
61.6% multi-item orders → clear path to expand combo deals.
Large pizzas dominate order share (value-seeking behavior).
Peak 5–8 PM; Sunday is the lowest → scheduling & promo timing.
November revenue spike with similar order counts → customers chose higher-value pizzas; run seasonal high-margin campaigns.
Top sellers: Classic Deluxe, Hawaiian, Pepperoni.
The dashboard lets owners optimize menu, inventory, and staffing with confidence. I learned to think like an operator, put metrics into context (MoM deltas), and use DAX + modeling to keep the experience fast and intuitive. Color choices were intentional to signal extremes without overwhelming the viewer.
Future Improvements
Market Basket Analysis to recommend combo pairings.
Forecasting for month/week demand.
Customer segmentation for targeted promotions.
+61 421 718 726
thanhthao.chu05@gmail.com